The Bight Runs on Sand: What’s Changed and What We Do Next

1) The Oceanside Littoral Cell (and where San Clemente fits)
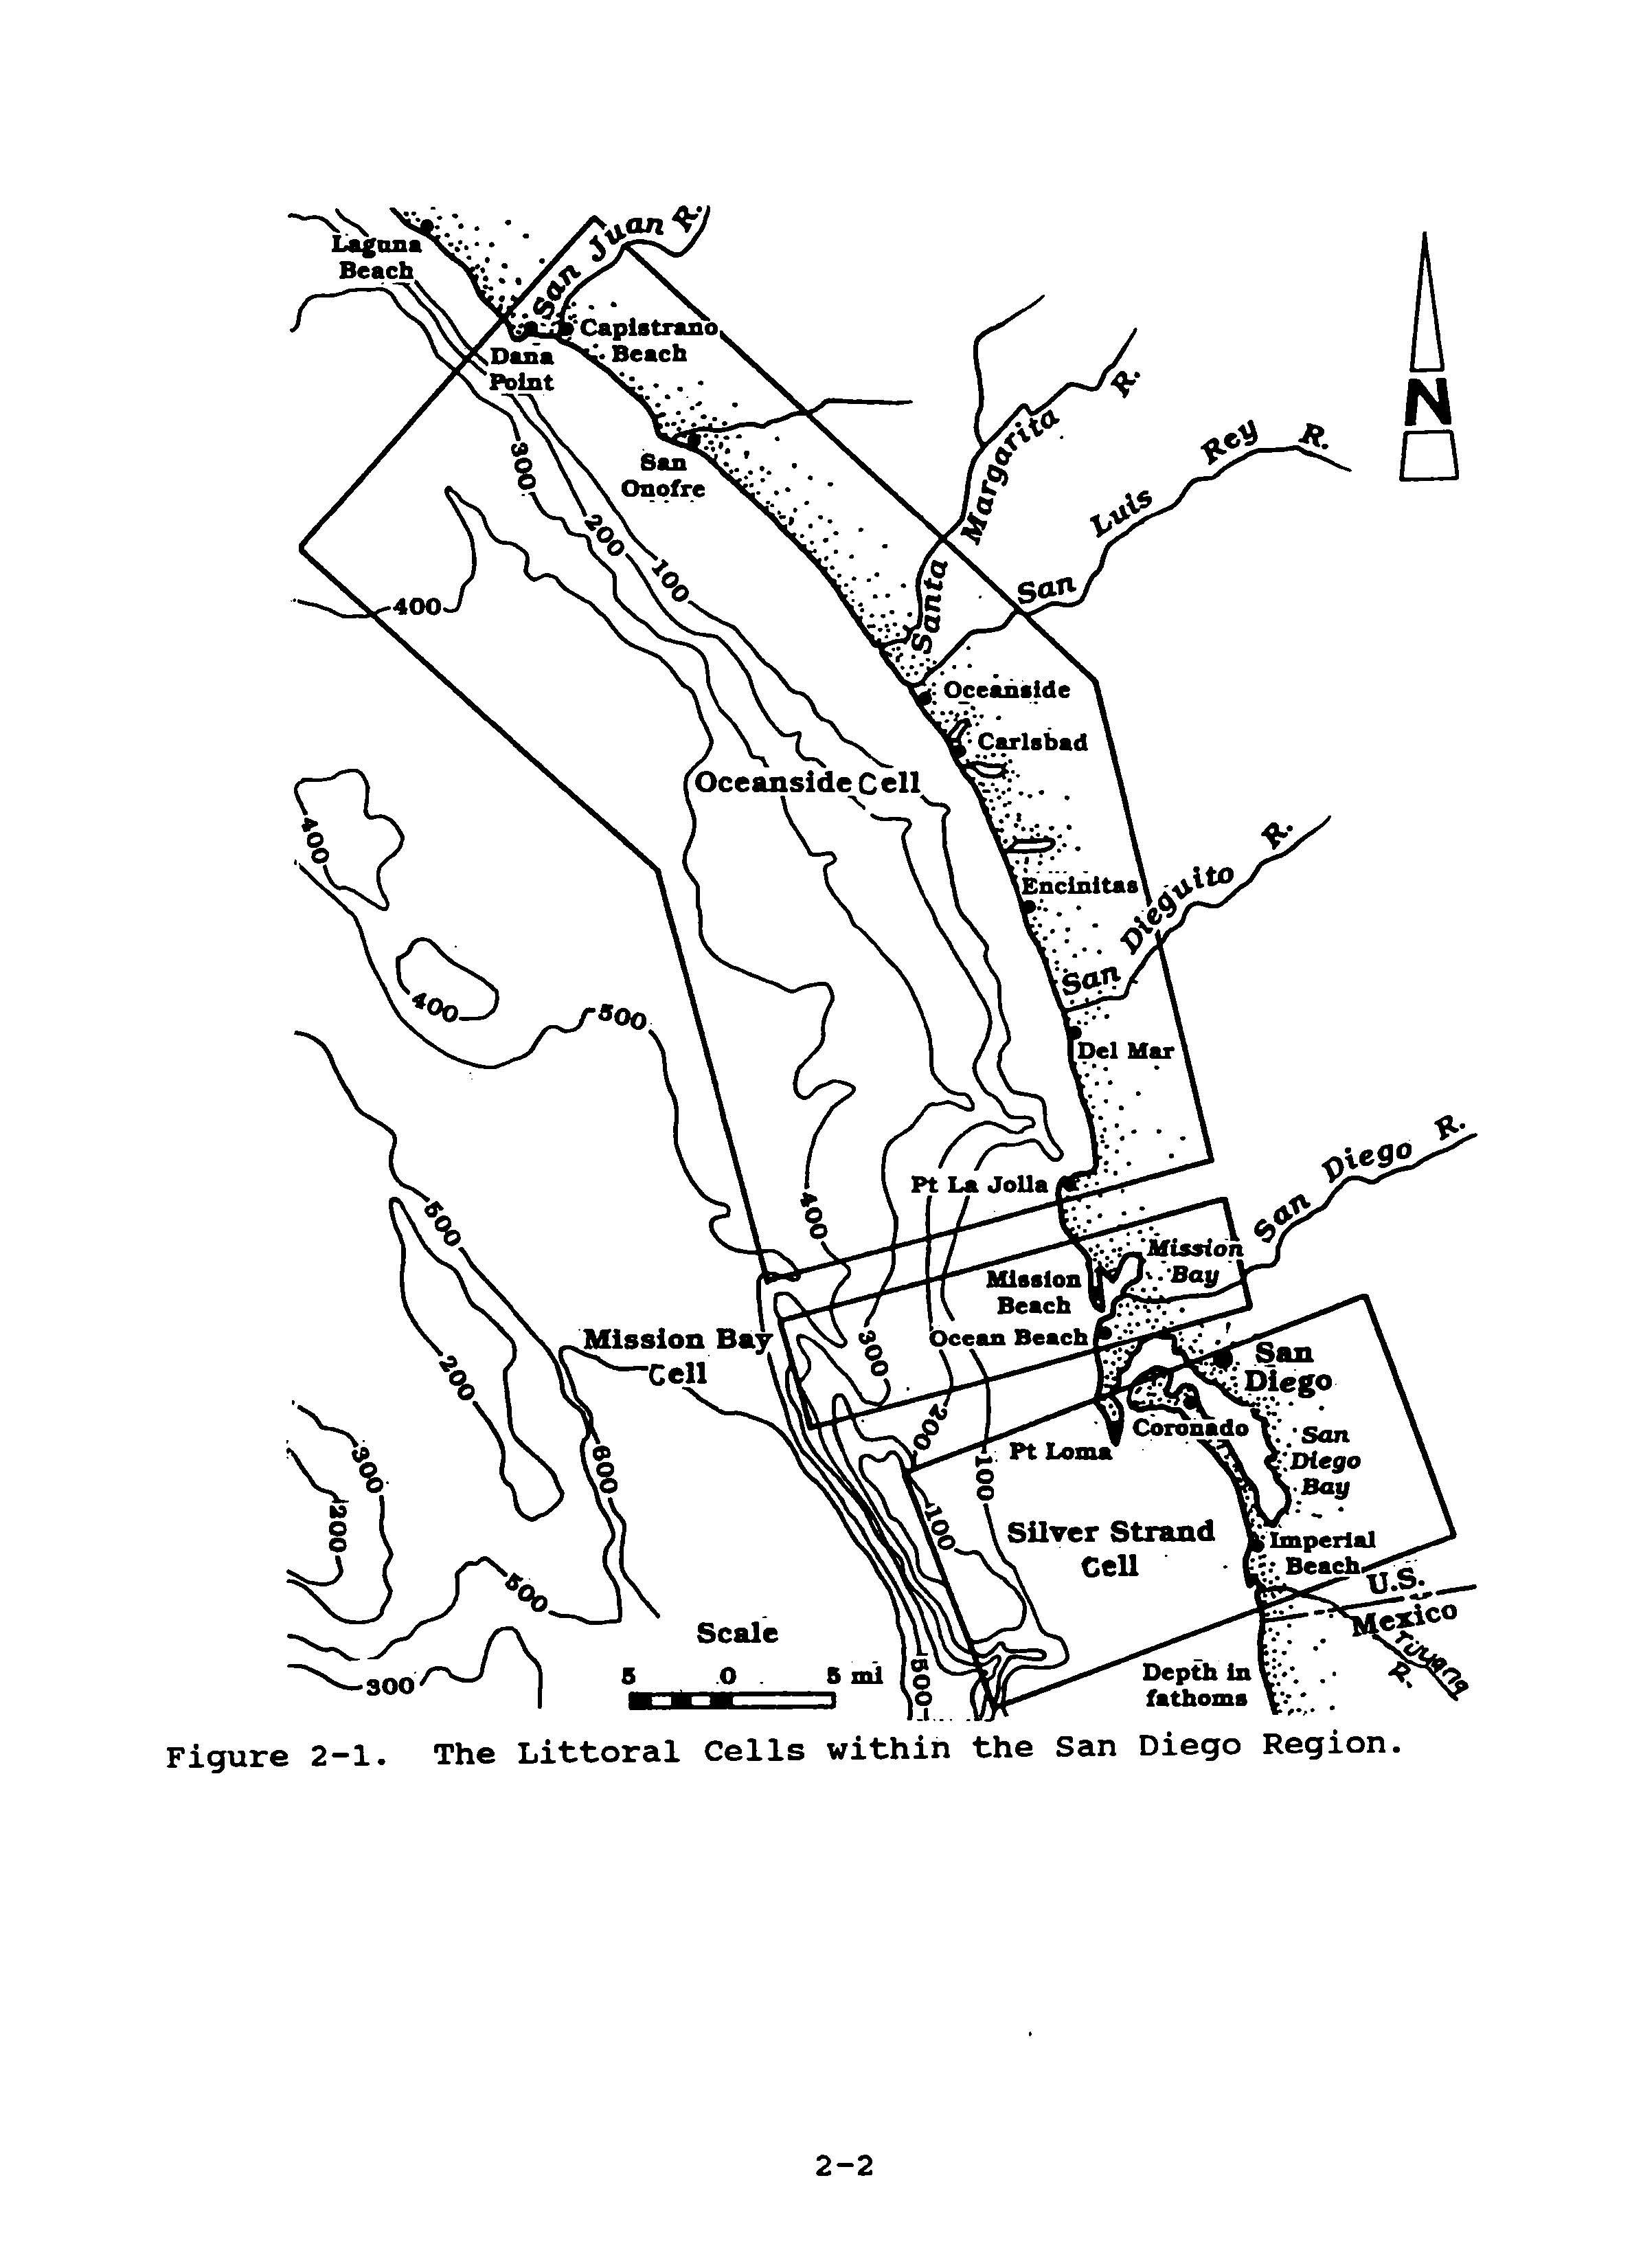
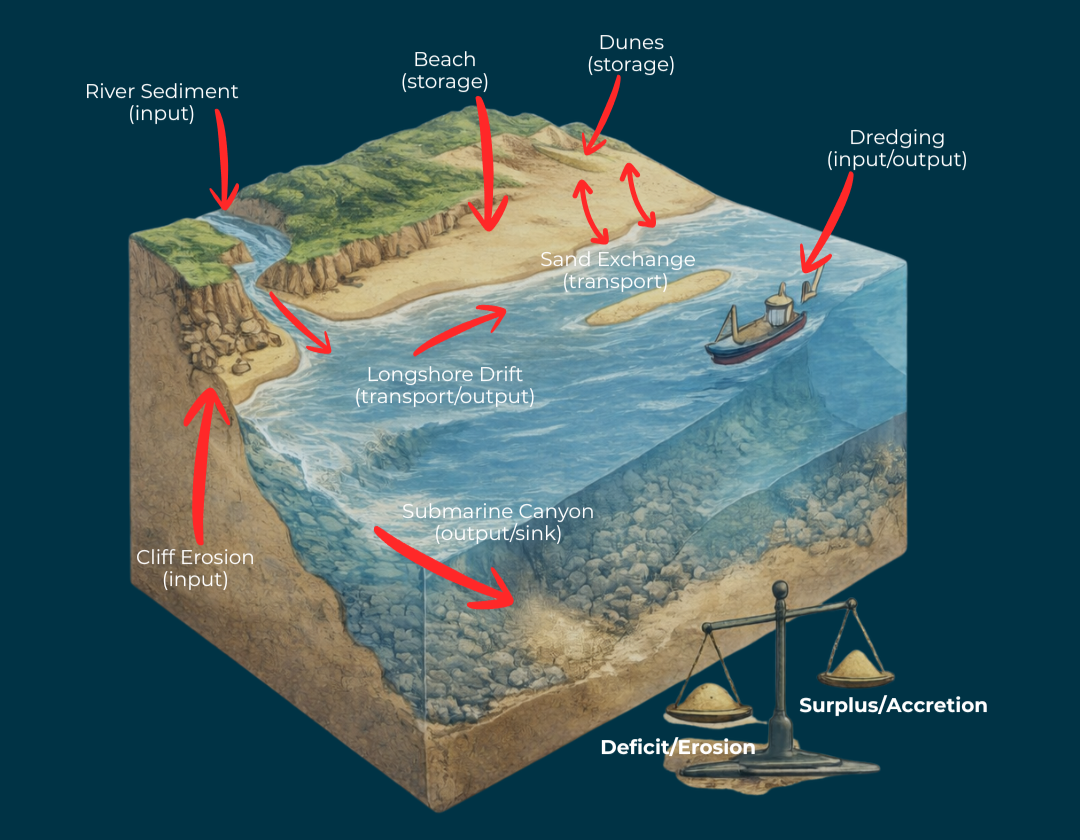
San Clemente sits inside the Oceanside Littoral Cell, a regional sand-transport system that generally runs from Dana Point south toward the La Jolla / Scripps submarine canyon area (USACE 1991). A littoral cell acts like a sand “system”: sand enters from sources like rivers, bluffs, and nourishment, moves along the shore with waves and currents, and eventually leaves at sinks like harbors, offshore deep water, or submarine canyons, usually within boundaries set by headlands or other natural features.
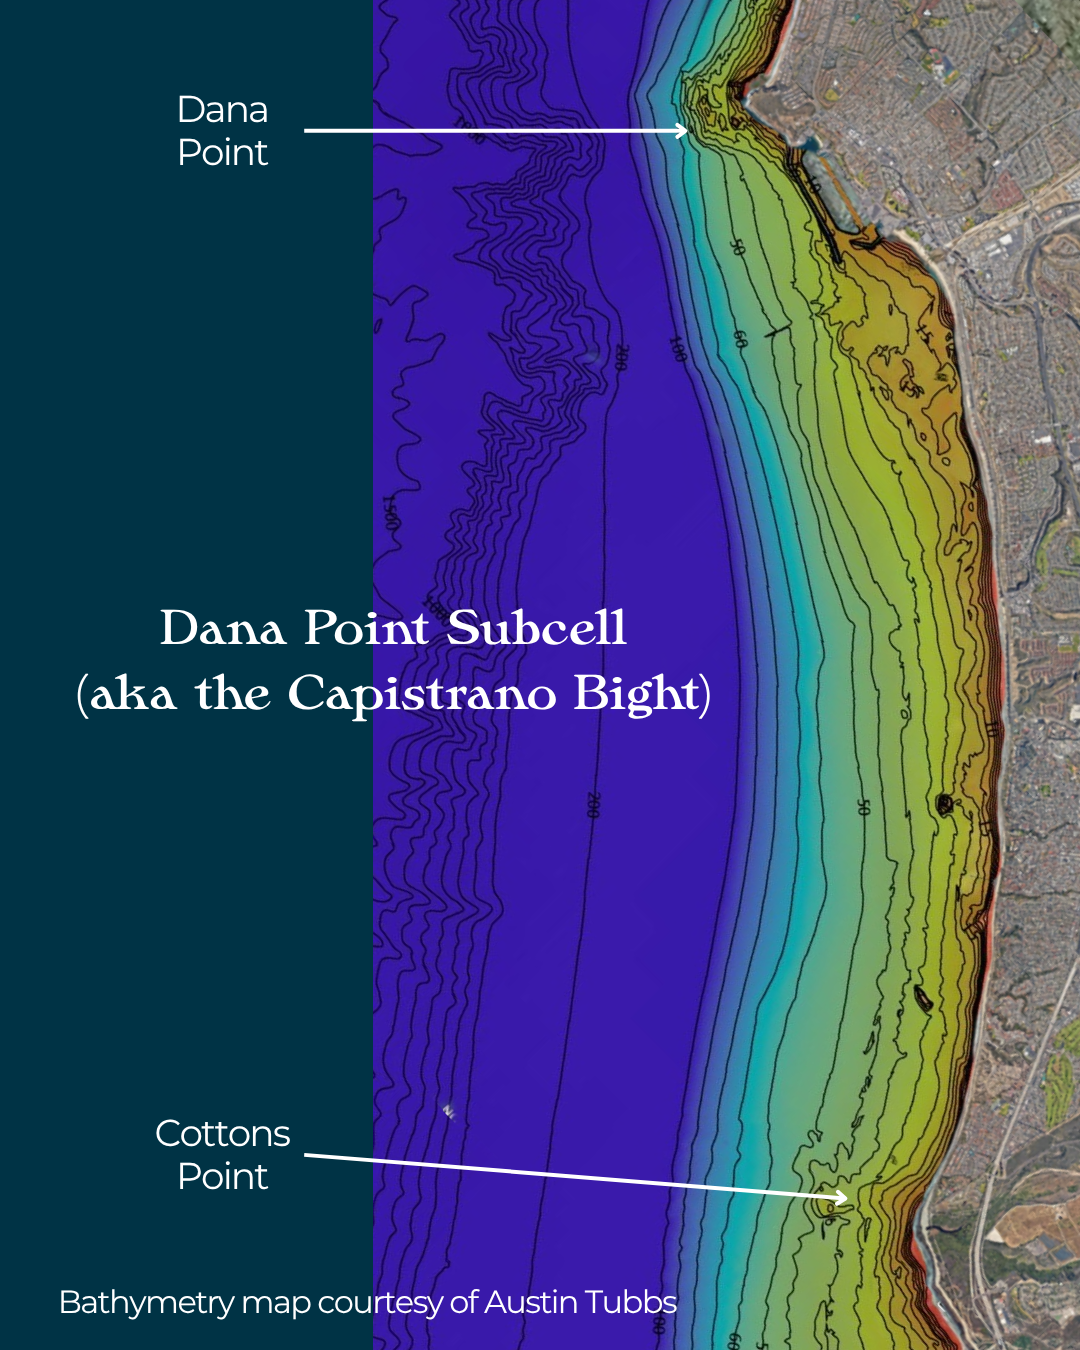
Within the Oceanside Cell, the stretch that includes San Clemente is commonly described as the Dana Point Subcell (also called the Capistrano Bight). This subcell is effectively bookended by Dana Point to the north and Cottons Point / San Mateo Point to the south (USACE 1991).
2) Historical sources of sand for the subcell
Historically, sand entered the Dana Point Subcell from three main pathways:
a) Rivers and creeks
Watersheds deliver sediment from the hills and mountains to the coast, often in pulses. Many local creek mouths are blocked by sand bars most of the year and only “break out” during significant rain events, so delivery is episodic, not steady. San Juan Creek is frequently cited as a major historic contributor to the Dana Point Subcell (USACE 2012, Moffatt & Nichol 2024, Coastal Environments 2014).
b) Bluff and cliff erosion
Coastal bluffs and cliffs can contribute sandy material when they erode or collapse. Historically, that material would fall onto the beach and be gradually worked into the active sand system, though armoring and development have reduced this contribution in many places.
c) Human “injections”
Since the 1960s, millions of cubic yards of sediment have been placed on beaches within the Capistrano Bight (USACE 1991, Moffatt 2024). The largest single “injection” is commonly tied to Dana Point Harbor construction, when excavated sandy material was placed on adjacent beaches, temporarily creating beach widths that likely would not have existed under natural sediment supply conditions. Additional “injections” have come from offshore borrow sites, inland sources, and sediment dredged from harbors/channels or sediment removed from behind inland dams.
3) Why this subcell tends to retain sand
The Capistrano Bight behaves like a semi-contained embayment: sand moves around inside it, but the ends act like bookends that reduce losses out of the system.

a) North bookend (Dana Point): Dana Point’s headland/harbor is widely treated as a functional boundary of the system. It acts like a groin, and limits sand from moving around the point, so sand tends to remain within the bight rather than freely escaping north.
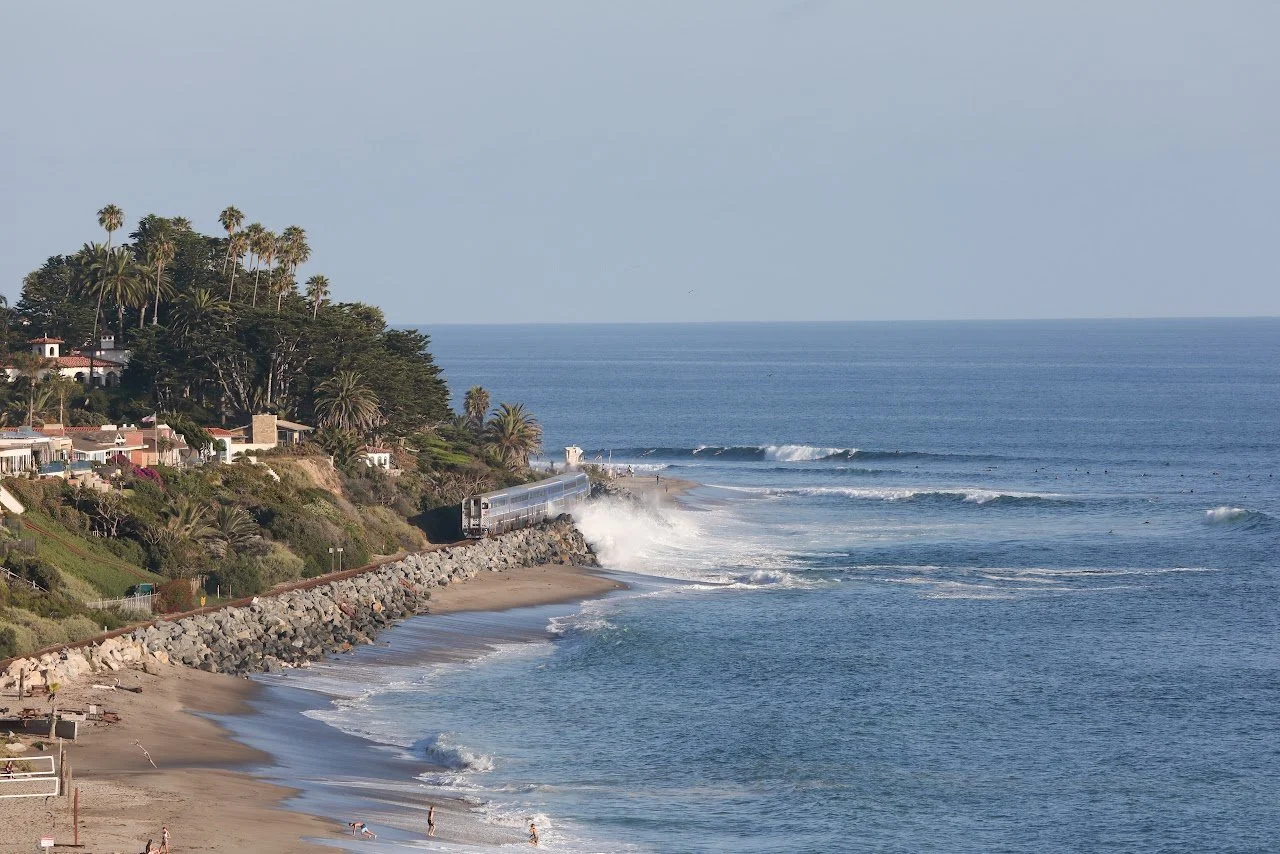
b) South bookend (Cottons / San Mateo Point): The nearshore bathymetry around San Mateo Point focuses wave energy and creates a distinct local wave pattern. No matter whether the swell direction is from the south or north-west, the waves at Cottons break in a peeling fashion, from South to North. The waves and current act as a conveyor belt, pushing sand north and preventing it from escaping to the south.
Because the subcell is bounded, sand delivered (or placed) into the system is more likely to stay in the bight and redistribute among beaches, rather than immediately exiting the system. A recent study by researchers at the University of California Irvine confirm the bight’s sand retaining characteristics (Kahl 2024).
4) Why energy matters: where sand goes in high-energy vs low-energy conditions
Within the Capistrano Bight, sand is constantly being moved around by wave energy. When energy is higher, sand is more likely to be pulled off the dry beach and shifted either alongshore (down the coast) and/or offshore into deeper water. Sand moved offshore often settles into bars just beyond the shoreline. Those bars matter because they cause waves to break farther out, dissipating energy offshore before it reaches the beach. In effect, sandbars act like a temporary offshore buffer and they set the stage for recovery when conditions calm. When energy eases, lower energy waves can push sand back onshore, rebuilding the beach face.
Hard coastal armoring changes this energy balance. When seawalls, revetments, and other hardened structures sit in the active surf zone, waves reflect and concentrate energy instead of dissipating it across a sandy beach. That elevated nearshore energy can scour the beach in front of the structure, making sand loss faster and recovery slower. In many cases, the beach doesn’t “vanish” because the sand is gone forever; it vanishes because the shoreline can no longer hold sand in place under that higher-energy setting.

Aerial view of Cottons Point.
The practical takeaway is simple: a sandy buffer in front of any existing structure is critical. Where the shoreline is pinned to hard infrastructure, losing that buffer can turn temporary narrowing into a more permanent state of beach loss. That’s why maintaining beach width through nourishment and sand retention is not optional on armored beaches, and why any new armoring should be approached with extreme caution, because it can increase nearshore energy, accelerate scouring, and ultimately shrink the very beach we’re trying to protect.
5) The sediment budget
A sediment budget is just “sand accounting.” Inputs (rivers, bluffs, nourishment) add sand to the shoreline. Losses (harbor traps, offshore sinks, deep-water losses) remove it. If inputs exceed losses, beaches widen. If losses exceed inputs, beaches narrow.
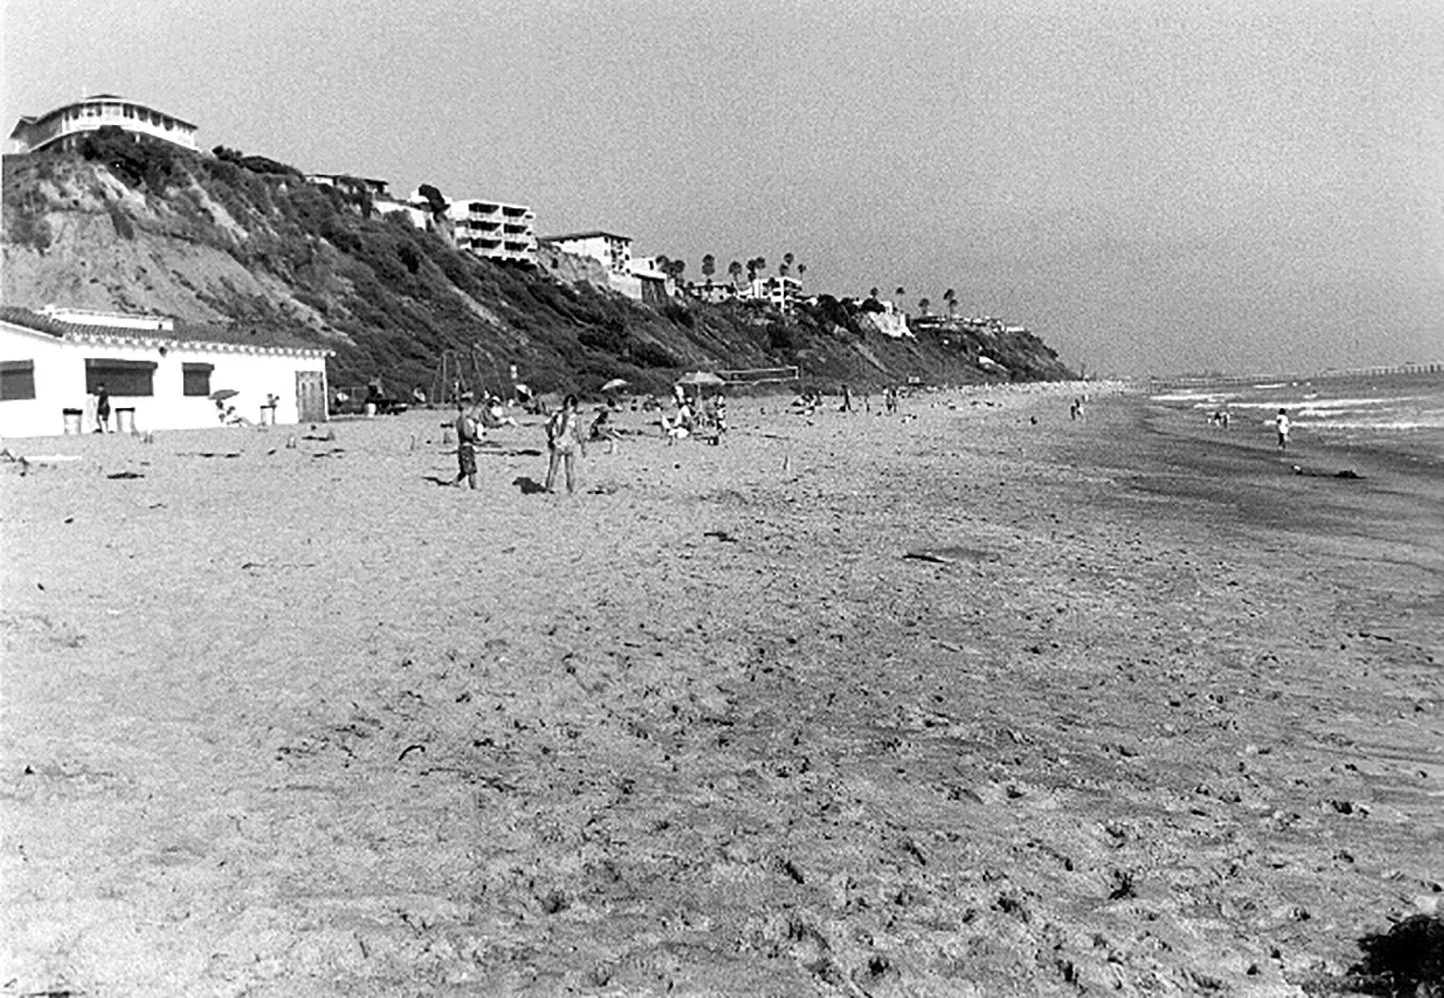
a) Big injections shaped what people remember as “wide beaches.”
During construction of Dana Point Harbor, about 2.4 million cubic yards of sandy material was excavated and placed on nearby beaches (Moffatt 2024), effectively a one-time reset that likely created artificially wide beaches compared to what would occur under reduced modern supply.
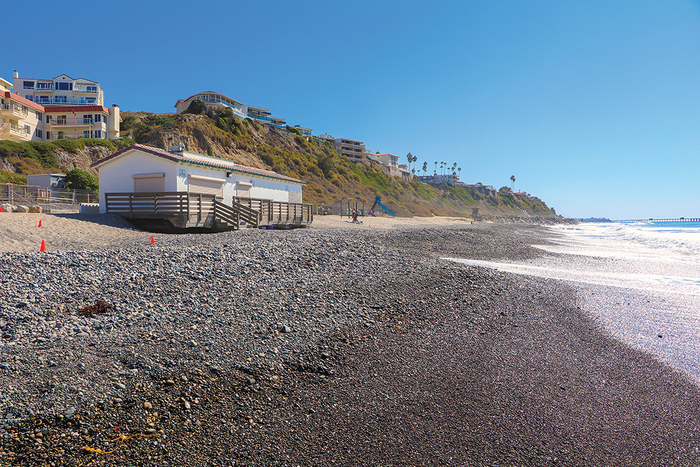
b) Sand supply has declined over time.
Multiple studies conclude that historic sediment yields from watersheds and bluffs have fallen due to:
o Flood-control infrastructure (dams, channelization, grade-control, etc.) reducing sediment delivery,
o Armoring and development reducing bluff erosion input, and
o Long stretches with limited nourishment relative to the large scale injections of the 1960s-1970s.
c) The “budget” depends on the era, and on whether it’s a wet or dry period.
The big point is simple: the Capistrano Bight doesn’t get the same amount of sand every decade. It changes with the era, and it changes with rainfall.
In 1991 (re-stated in 2012), the U.S. Army Corps of Engineers looked at the Capistrano Bight across three different windows: 1900–1938, 1960–1978, and 1983–1990. Their takeaway wasn’t that the system “stopped working.” It was that the system sits close to break-even most of the time, meaning it doesn’t take much to tip it toward widening or narrowing. The clearest trend was less river sand showing up over time, decreasing from roughly 65,000 cubic yards per year in the earliest period to 0 cubic yards per year in the last, consistent with watershed changes that reduce sediment delivery (USACE 1991, USACE 2012)
Other estimates for San Juan Creek tell the same story: depending on the study and the time period, the creek’s sand contribution ranges widely (roughly 8,000 to 52,000 cubic yards per year), and the Corps used an average planning value around 27,000 cubic yards per year (USACE 2012, USACE 2013).
A later regional assessment in 2014 makes the wet-year vs. dry-year swing really clear (Coastal Environments 2014). It estimated that this bight runs about 50,000 cubic yards per year short in dry years, but is close to break-even in wet years (around +3,000 cubic yards per year). In other words, during long drought stretches the bight can stack up “sand deficits” year after year, and because there hasn’t been much large-scale nourishment since the 1960s-70s, those deficits don’t get periodically reset. That would explain why the late-2010s into early-2020s drought lined up with visible beach narrowing across the bight, and why recovery today feels slower or non-existent.